
Key Differences
1. Nature of Observed Systems
- Traditional & Cloud Native Applications:
- Focus on infrastructure health, uptime, performance, error rates, and resource utilization.
- Systems produce consistent, deterministic outputs given the same inputs.
- LLM & AI Applications:
- Deal with non-deterministic, probabilistic outputs: the same prompt can yield different responses.
- Application behavior can change over time without explicit code or config changes, due to retraining, model drift, or dynamic input data.
Key takeaways
- LLM and AI application observability extends traditional and cloud native observability to handle non-deterministic outputs, where the same prompt can yield different responses.
- Instead of binary success metrics, LLM observability tracks hallucinations, bias, toxicity, PII leakage, drift, and cost per request, along with semantic quality of responses.
- Cost tracking for AI applications shifts from CPU, memory and network usage to API costs, token usage, and model-specific pricing.
- OpenLLMetry extends OpenTelemetry with LLM-specific instrumentation and semantic conventions, establishing a standardized observability backbone for LLM and GenAI applications.
- LangSmith adds end-to-end trace logging, debugging, live dashboards, and automated or human evaluation, and it ingests OpenLLMetry and OpenTelemetry traces.
2. Data Types and Success Metrics
- Traditional & Cloud Native:
- Relies on telemetry: metrics, logs, and traces from servers, containers, and networking.
- Success generally binary (success/failure, error/no error).
- LLM & AI:
- Incorporates semantic analysis of inputs and outputs, contextual appropriateness, and subjective measures of response quality.
- Tracks advanced metrics: hallucinations, bias, toxicity, PII leakage, drift, and cost per request.
- Evaluates model and data pipeline health, explainability, and fairness.
3. Observability Approach
| Aspect | Traditional & Cloud Native | LLM & AI Application |
| Focus | System performance, error rates, logs | Model behavior, data integrity, semantic correctness |
| Approach | Reactive (alerts after issues) | Proactive (detects issues before failures using deep analytics) |
| Measurement | Predefined metrics, threshold-based | Subjective evaluation, output quality, model scoring |
| Data Volume | High in cloud native (due to microservices, containers) | Often massive, but also includes unstructured and complex semantic data |
| Complexity | Well-understood problem domains | Models can “drift” unexpectedly; root cause analysis spans algorithm, data, external context |
4. Cost and Resource Tracking
- Traditional Applications:
- Monitor CPU/memory/network usage.
- LLM & AI Applications:
- Track API costs, token usage, and model-specific pricing—critical for managing the economics of production AI.
5. Explanation and Root Cause Analysis
- Traditional:
- Focuses on what happened (error codes, stack traces).
- LLM & AI:
- Focuses on why a model’s output may have degraded, investigating model drift, prompt changes, context shifts, or incorrect predictions.
- Uses advanced visualizations and rich context to analyze failures at the data and semantic level rather than only the infrastructure.
6. Security, Compliance, and Governance
- Traditional & Cloud Native:
- General security and compliance monitoring at the infrastructure or application tier.
- LLM & AI Applications:
- Proactively monitor for bias, privacy violations (PII), hallucinations, and regulatory compliance at the input/output and decision layer.
Summary Table
| Dimension | Traditional Observability | Cloud Native Observability | LLM & AI Application Observability |
| Determinism | High | High | Low |
| Key Artifacts | Metrics, logs, traces | Metrics, logs, traces, container data | Model input/output, semantics, tokens |
| Root Cause Scope | Infrastructure, code | Dynamic infrastructure, microservices | Model, data, prompts, context |
| Success Metrics | Uptime, error rates | Resource, performance, service uptime | Output quality, bias, drift, cost |
| Main Risks | Outage, slowness, data loss | Outage, scaling, service breakdown | Hallucination, bias, compliance, cost |
| Observability Tools | APM, logging, tracing frameworks | Unified full-stack tools, AIOps | Specialized AI/LLM monitoring platforms |
Roles of OpenLLMetry and LangSmith in LLM & AI Application Monitoring
OpenLLMetry extends the industry-standard OpenTelemetry framework with features specifically for monitoring large language model (LLM) and GenAI application behavior
- Automated Instrumentation & Standardized Metrics: OpenLLMetry makes it easy to collect, structure, and standardize mission-critical LLM metrics—such as prompt/response data, token usage, latency, cost, error rates, and more—across diverse setups and providers.
- Seamless Integration: Provides native support for popular LLM frameworks, like LangChain and LlamaIndex, allowing for instrumenting complex multi-agent or multi-step LLM workflows with minimal additional code. It’s also compatible with broader ecosystem tools (e.g., Grafana, Prometheus) for visualization and alerting.
- Advanced LLM Tracing: Captures detailed traces of LLM prompt flows, agent chains, function/tool usage, and retrieves spans with semantic context, enabling deep debugging and performance analysis specific to generative AI apps.
- OpenTelemetry Semantic Conventions for LLMs: Defines and adopts new conventions tailored to LLMs, now part of the official OpenTelemetry standard, ensuring consistency and richer insights across the industry.
- Cost and Error Tracking: Enables fine-grained monitoring of API calls, costs per token, error events, and system bottlenecks—key for managing ROI and reliability in production AI applications.
LangSmith: LLM-Focused Tracing, Debugging, and Evaluation
LangSmith is designed to be a comprehensive platform for monitoring, debugging, and evaluating LLM-powered applications:
- End-to-End Trace Logging: Records and visualizes the full execution paths of LLM and agent chains—including every step, prompt, tool call, and response—making root-cause analysis and debugging significantly more effective than generic APM tools.
- Native OpenTelemetry Support (with OpenLLMetry): Ingests distributed traces in OpenTelemetry and OpenLLMetry format, unifying LLM activity monitoring with wider system telemetry data—ideal for teams managing hybrid architectures or integrating with existing DevOps stacks.
- Quality and Evaluation Metrics: Supports dataset-driven testing, automated and human-in-the-loop output evaluation, and detailed error/latency monitoring. This helps track and improve output quality, prompt engineering, and user satisfaction.
- Live Dashboards & Alerts: Real-time dashboards for costs, error rates, latency, and response quality, along with customizable alerts for business-critical performance or compliance deviations.
- Framework-Agnostic & Collaborative: While closely integrated with LangChain, LangSmith works with any LLM/agent framework. It enables collaboration across development, product, and analytics teams for refining prompts, reviewing logs, and tracking changes at scale.
How These Tools Work Together
OpenLLMetry and LangSmith significantly enhance LLM performance monitoring and debugging by providing unified, LLM-native observability, end-to-end tracing, and targeted diagnostics tailored to the unique challenges of generative AI applications.
Key ways these tools improve performance monitoring and debugging:
- Standardized, End-to-End Tracing: OpenLLMetry brings OpenTelemetry’s open standard for distributed tracing to LLM pipelines, capturing every step of an LLM app from prompt generation to agent/tool invocation and final output. LangSmith builds on this, allowing users to ingest, visualize, and analyze these traces in detail—whether using the LangSmith SDK or OpenTelemetry—in a centralized dashboard.
- Unified Observability Across the Stack: Through OpenLLMetry’s compatibility with OpenTelemetry, you can correlate LLM runs with wider application and infrastructure telemetry (such as logs, metrics, and traces from microservices) in the same workflow. LangSmith enables visibility into the complete execution path, linking LLM agent behavior with backend system metrics for deeper root-cause analysis.
- Performance Metrics and Bottleneck Detection: Both tools provide fine-grained monitoring of LLM-specific metrics such as latency, token usage, RPC calls, cost per request, error rates, prompt/response content, and more. This helps teams pinpoint where performance lags (e.g., slow model inference, API bottlenecks, inefficient prompt chains), optimize cost, and enhance runtime reliability.
- Real-Time Debugging and Root Cause Analysis: LangSmith’s tracing system logs every input, output, agent step, and metadata. Engineers can filter runs, inspect errors in context, and drill into failed or slow chains with full semantic context, accelerating bug investigation and resolution. OpenLLMetry ensures these traces follow distributed requests (with proper context propagation) even in complex, multi-service LLM deployments.
- Evaluation & Quality Assurance: LangSmith enables users to turn production traces into datasets for automated and manual evaluations (e.g., relevance, correctness, harmfulness) using both LLM-as-Judge and human feedback. This closes the loop for iterative improvement between monitoring, testing, and debugging.
- Interoperability & DevOps Integration: By exporting data in OpenTelemetry format, these tools feed directly into popular observability platforms (Datadog, Grafana, Jaeger, etc.), simplifying integrations with broader organizational monitoring and alerting systems.
Summary Table
| Capability | OpenLLMetry | LangSmith |
| Standardized Tracing | ✅ (OpenTelemetry format for LLMs) | ✅ (Ingests OpenTelemetry/OpenLLMetry & native) |
| Deep LLM Observability | ✅ | ✅ |
| Real-Time Debugging | Indirect (via OTel-compatible platforms) | ✅ (LLM-native UI, no added latency) |
| Evaluation Framework | ❌ | ✅ (auto/manual LLM evaluations) |
| Root Cause Analysis | ✅ (at trace level) | ✅ (semantic, agent-step detail) |
| DevOps Integration | ✅ | ✅ |
In essence, OpenLLMetry establishes the observability backbone for LLMs, while LangSmith delivers turnkey end-to-end monitoring, deep debugging, evaluation, and collaborative prompt iteration—driving faster, more reliable AI development and maintenance
Call to Action
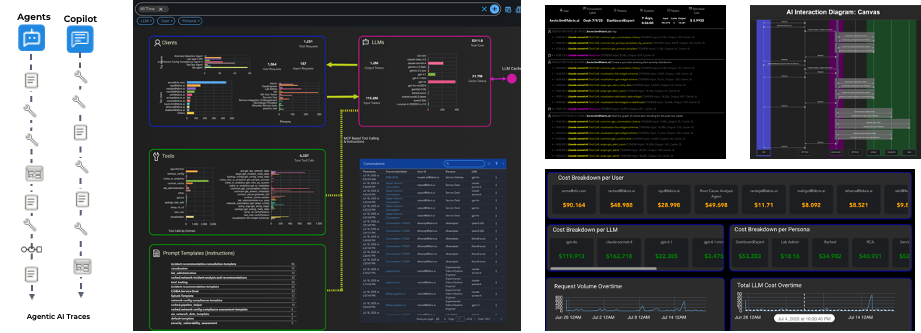
Fabrix’s Agentic AI platform has extended its observability, AIOps and AI agents capabilities for Agentic and LLM applications. Check out our capabilities
Conclusion
LLM and AI application observability extends the principles of traditional and cloud native observability, adapting them to address non-deterministic, highly complex, and often subjective behaviors. They require deeper, context-rich analytics, new success metrics, and proactive governance to ensure the safety, fairness, and reliability of AI-powered products in production environments. OpenLLMetry and LangSmith bring much-needed transparency and proactive monitoring to the unique challenges of LLM and GenAI applications, advancing the state of observability beyond traditional metrics to cover the quality, cost, and reasoning behaviors of language models in production
Frequently Asked Questions
What is LLM observability?
LLM observability is the practice of monitoring large language model and AI applications for model behavior, data integrity and semantic correctness, not just infrastructure health. It tracks metrics such as hallucinations, bias, toxicity, PII leakage, drift and cost per request, and evaluates output quality. It extends traditional observability to handle non-deterministic, probabilistic systems whose behavior can change without code changes.
How is LLM observability different from traditional observability?
LLM observability differs from traditional observability because AI systems are non-deterministic, while traditional and cloud native systems produce consistent outputs for the same inputs. Traditional observability relies on metrics, logs and traces with mostly binary success measures. LLM observability adds semantic analysis of inputs and outputs, subjective quality scoring, and root cause analysis spanning the model, data, prompts and context.
What metrics should you track for LLM applications?
LLM applications should be tracked on output quality, hallucinations, bias, toxicity, PII leakage, drift and cost per request. Operational metrics include latency, token usage, error rates and prompt and response content. Cost tracking should cover API costs, token usage and model-specific pricing, which are critical for managing the economics of production AI and spotting bottlenecks such as inefficient prompt chains.
What is OpenLLMetry?
OpenLLMetry is an extension of the OpenTelemetry framework built for monitoring LLM and GenAI application behavior. It automatically collects standardized metrics such as prompt and response data, token usage, latency, cost and error rates. It supports frameworks like LangChain and LlamaIndex, captures detailed traces of prompt flows and agent chains, and exports data to platforms such as Grafana, Prometheus, Datadog and Jaeger.
How do OpenLLMetry and LangSmith work together?
OpenLLMetry provides the standardized observability backbone, and LangSmith ingests its OpenTelemetry format traces for deep analysis. OpenLLMetry captures LLM-specific metrics and distributed traces with proper context propagation across services. LangSmith adds an LLM-native interface for real-time debugging, live dashboards and alerts, and an evaluation framework that turns production traces into datasets scored with LLM-as-Judge and human feedback.