Network Observability
One solution for end-to-end performance, health and operational insights for multi-layer, multi-domain networks
Unified Network Observability
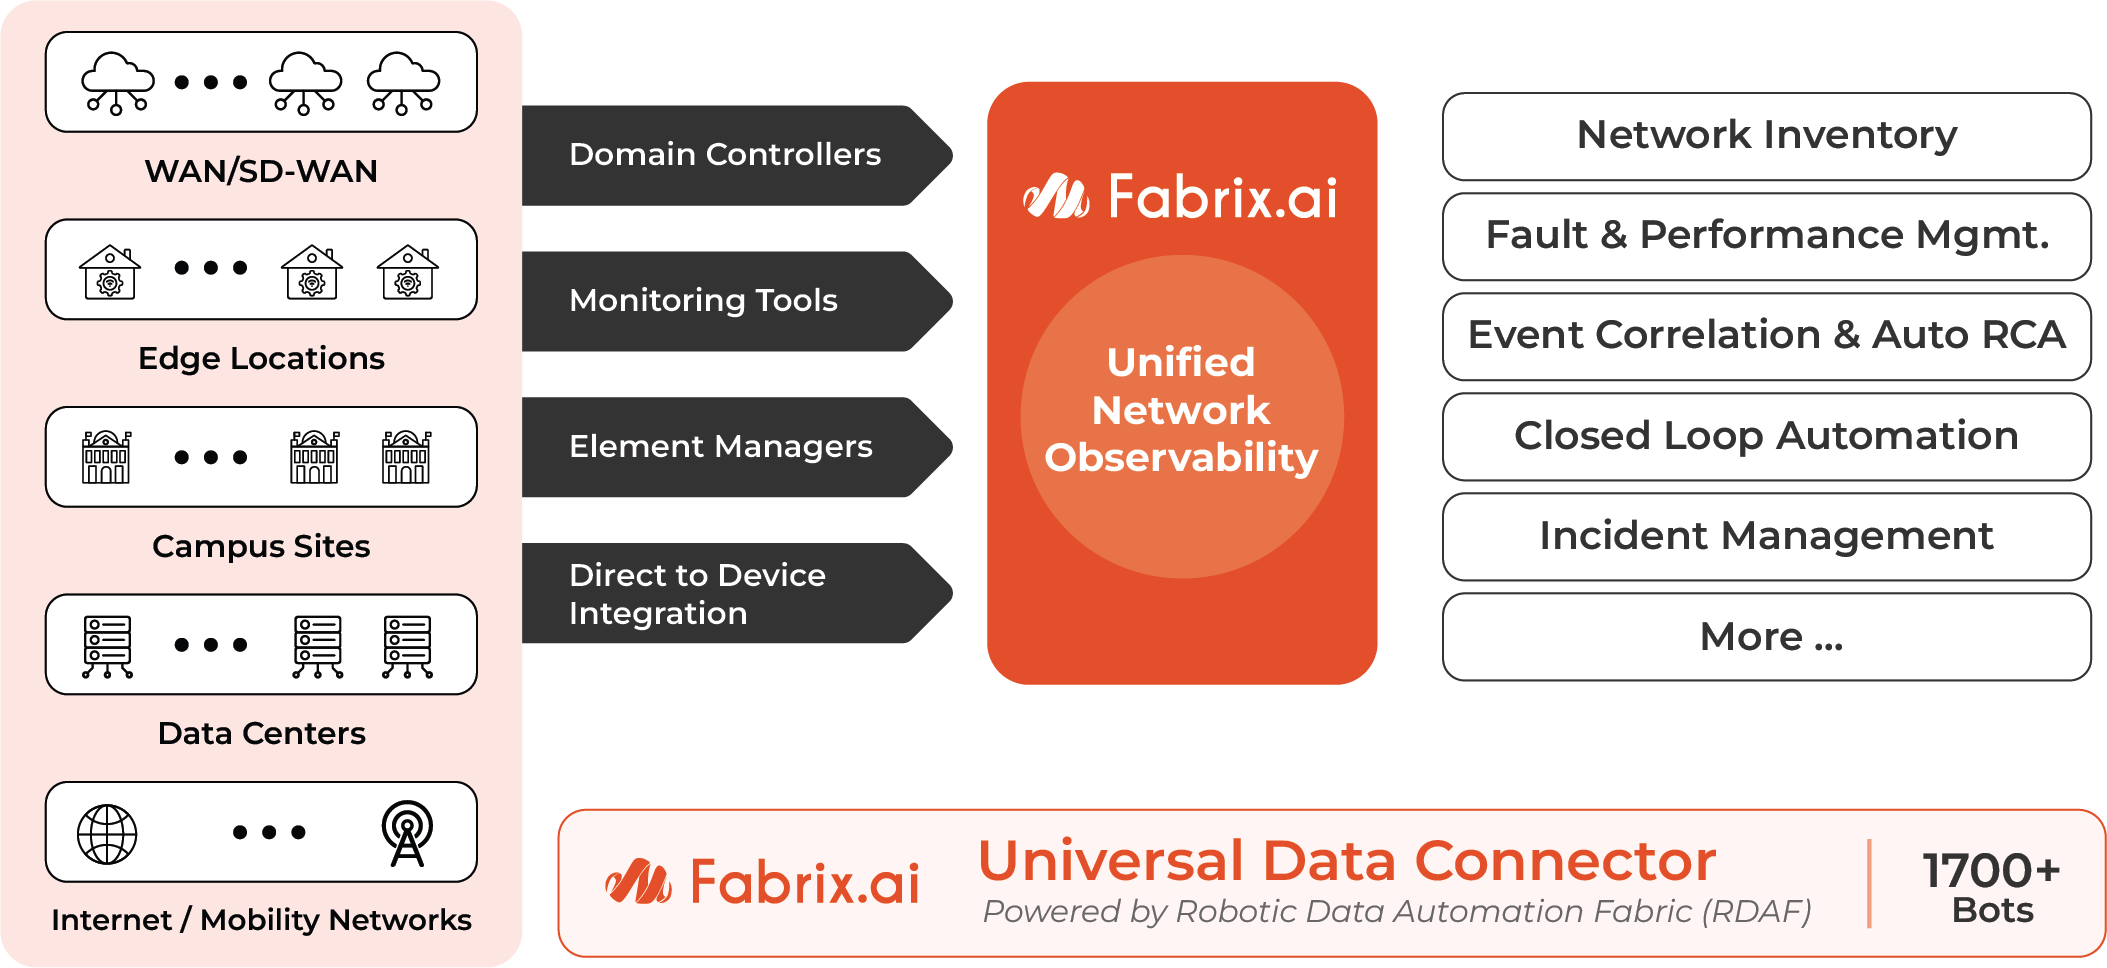
AI-driven end-to-end network operations. Beyond security logs, tap into diverse IT, infrastructure and network data to gain unparalleled insights and visibility across your entire ecosystem.
-
Comprehensive Network Topology
Automated discovery and mapping of network devices, protocols (CDP, OSPF, BGP, LLDP, ISIS) and relationships.
-
Contextual IT Asset Insights
Real-time visibility into IT asset capacity, utilization, lifecycle and compliance, with CMDB sync.
-
Application Dependency Mapping
End-to-end visibility into application interactions, dependencies and performance: service analyzer views, entities and KPIs.
-
Full-Stack Visibility
Unified monitoring of applications, servers, VMs, network and storage for optimal performance.
-
Telecom / Service Provider Insights
IP transport, backhaul networks and evolved packet core analytics for telecom and CSPs.
-
Multi-Vendor IT & Infrastructure Visibility
Integrated views of diverse IT, infrastructure and network assets across data center, campus, edge and SD-WAN.
Seamless Data Integration with Fabrix.ai
Powerful data ingestion, low-code/no-code pipelines and a library of 1000+ data bots make it easy to bring in data from diverse sources, reduce data bloat, break silos and gain contextualized insights across domains.
Leverage pre-packaged solution packs to connect with:
Multi-Source Integration
- Domain controllers Cisco DNAC, NDFC, Prime, Meraki, Intersight, vManage, VMware vCenter, VeloCloud, Microsoft SCOM and more
- Monitoring tools AppDynamics, ThousandEyes, SolarWinds, ScienceLogic, Zabbix, Prometheus and more
- Element managers Cisco UCS Manager, HPE OneView, Fortinet FortiManager and more
- Direct device integration APIs, SSH/CLI, SNMP, NetConf, gNMI/gRPC and more
- Object stores & data lakes OpenSearch/Elasticsearch, MinIO, AWS S3, Azure Data Lake and more
Diverse Protocols & Integration Schemes
- Discovery / inventory SNMP, SSH/CLI, WinRM, PowerShell, APIs
- Network management SNMP, REST APIs, SSH/CLI
- Streaming telemetry gNMI/gRPC, Kafka, NATS, MQTT
- Performance data BulkStats, SNMP, OpenTelemetry, Redfish
- Topology & protocols CDP, LLDP, BGP-LS, OSPF-TE, ISIS
- Telco networks 3GPP/ETSI management interfaces, TM Forum MTOSI, XML
Bring Your Own Data & Tools
Fabrix.ai supports an extensive range of data sources and integrations, so you can bring your own data and tools. Explore a selection of key supported integrations.
For the full list, visit our documentation site.
| Category | Description | Protocols |
|---|---|---|
| Network | Cisco IOS Devices (includes XR/ XE) | SNMPSSH |
| Cisco NXOS Devices | SNMPSSH | |
| Cisco BulkStats Ingestion for Cisco StarOS | Files | |
| Cisco ACI APIC | API | |
| Arista BigSwitch | SNMPSSH | |
| Juniper Network Devices | SNMPSSH | |
| Standard Interface | SSH | SSH |
| SNMP V1,v2c,v3 Including Traps | UDP | |
| Syslog Notifications | TCP/SSLUDP | |
| JSON over TCP (ex: rsyslog, fluentd) | TCP/SSL | |
| Webhook Notifications | HTTPS | |
| Elastic Filebeat & Winlog Beat | HTTPS | |
| REST Endpoints | HTTPS | |
| GraphQL | API | |
| CSV, JSON, Parquet, Avro, ORC | API | |
| HDFS | API | |
| OpenTelemetry Export | API | |
| CiscoDevNet YangSuite | API | |
| gNMI Telemetry | API | |
| Manager | Cisco UCS Manager | API |
| Cisco Intersight | API | |
| HP Network Assistant | API | |
| HP OneView | API | |
| HP OneView Dashboard | API | |
| Dell OpenManage | API | |
| Business Critical Services operational insights | API | |
| ITOM | Cisco ThousandEyes Digital Experience Monitoring | API |
| Cisco Accedian Skylight | API | |
| VMWare VROPS (ITOM) | API | |
| PRTG (ITOM) | API | |
| Zabbix (ITOM) | API | |
| OpsManager (ITOM) | API | |
| Nagios (ITOM) | API | |
| Prometheus (ITOM) | API | |
| MotoData (ITOM) | API | |
| Datadog | API | |
| SDWAN | Cisco Catalyst Center SDWAN vManage | API |
| VMWare VeloCloud Orchestrator | API | |
| Compute | Cisco UCS C-Series | API |
| Redfish protocol for compute infrastructure | API | |
| IP Telephony | Cisco Unified Call Manager API | API |
| Storage | EMC Isilon | SSH |
| EMC Unity | SSH | |
| EMC Xtreme | SSH | |
| NetApp 7Mode/C-Mode | API | |
| HPE 3Par | SSH | |
| HPE Primera | API | |
| PureStorage | API | |
| Virtualization | VMWare vCenter | API |
| NSX Networking | API | |
| OpenStack | API | |
| OS | Linux Inventory | SSH |
| All Windows Servers | WinRMSSH | |
| AIX Inventory | SSH | |
| Microservices | Kubernetes | APISSH |
| HashiCorp Consul | API | |
| HPE Ezmeral k8s | API | |
| IBM OpenShift Platform | API | |
| Istio ServiceMesh | API | |
| Message Queue(note-2) | NATS | API |
| MQTT | API | |
| AWS SQS | API | |
| AWS Kinesis | API | |
| Kafka | API | |
| RabbitMQ | API | |
| Database | MySQL/ MariaDB | SQL over TCP/SSL |
| Oracle DB | SQL over TCP/SSL | |
| Microsoft SQL Server | SQL over TCP/SSL | |
| Influx TS DB | API | |
| Controller | Cisco Meraki | API |
| Cisco DNA Center | API | |
| Cisco NDFC/DCNM | API | |
| Cisco Prime Network, Prime Performance Manager | API | |
| APM | AppDynamics | API |
| Dynatrace | API | |
| IBM Instana | API | |
| ManageEngine AppManager | API | |
| IPAM | Infoblox NetMRI | API |
| Bluecat IPAM | API | |
| ITSM | ServiceNow Incidents | API |
| ServiceNow CMDB | API | |
| ServiceDesk Plus | API | |
| ServiceDesk Plus-CMDB | API | |
| PagerDuty | API | |
| Jira Issues | API | |
| BMC Remedy Ticketing | API | |
| Cisco Smart Bonding for Partners | API | |
| OpsGenie | API | |
| DevOps | GitHub | API |
| RSS feeds for Vulnerabilities | API | |
| TeamCity CI/CD | API | |
| The toolset includes JIRA, GitLab, Jenkins, SonarQube, JFrog Artifactory, UCD, AppScan and Selenium | API | |
| DR | HPE Zerto | API |
| BaaS | Commvault Backup | API |
| Cloud Infra & Cloud Services | AWS EC2 | API |
| AWS CloudWatch (ITOM) | API | |
| Google Cloud | API | |
| Azure Cloud | API | |
| AWS Kinesis Streaming Analytics | API | |
| AWS EKS Service | API | |
| Azure Analytics | API | |
| Data Platforms | Read from S3 and ingest to Snowflake with Snowpipe | Snowpipe |
| Spark ingest/read in Parquet/Avro | API | |
| Object Storage | AWS Simple Storage Service | API |
| MinIO Object Storage | API | |
| Google Cloud Platform Object Storage | API | |
| Azure Blob Storage | API | |
| HPE Data Fabric | API | |
| Scallity RING and Artesca | API | |
| Cloudian Hyperstore | API | |
| Hitachi Content Platform | API | |
| Lyve Cloud | API | |
| ECS - Elastic Cloud Storage | API | |
| OCSF - Open Cybersecurity Schema Framework | API | |
| SIEM | Splunk SIEM | API |
| ElasticSearch (OpenSearch) | API | |
| ArcSight | API | |
| IBM QRadar | API |
Infrastructure and Network-centric
Operations Experience in Fabrix.ai
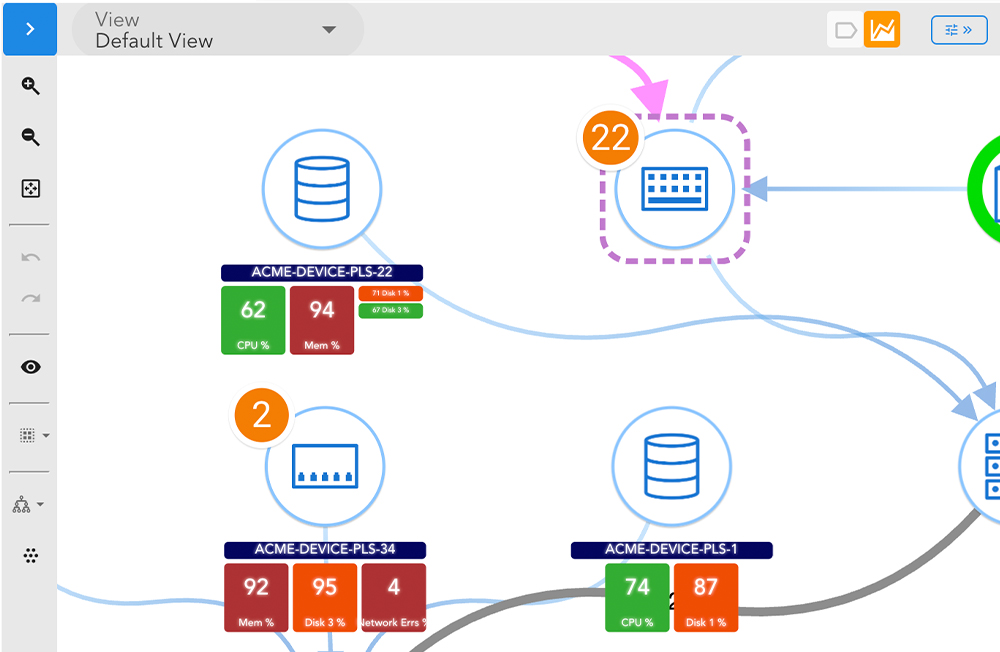
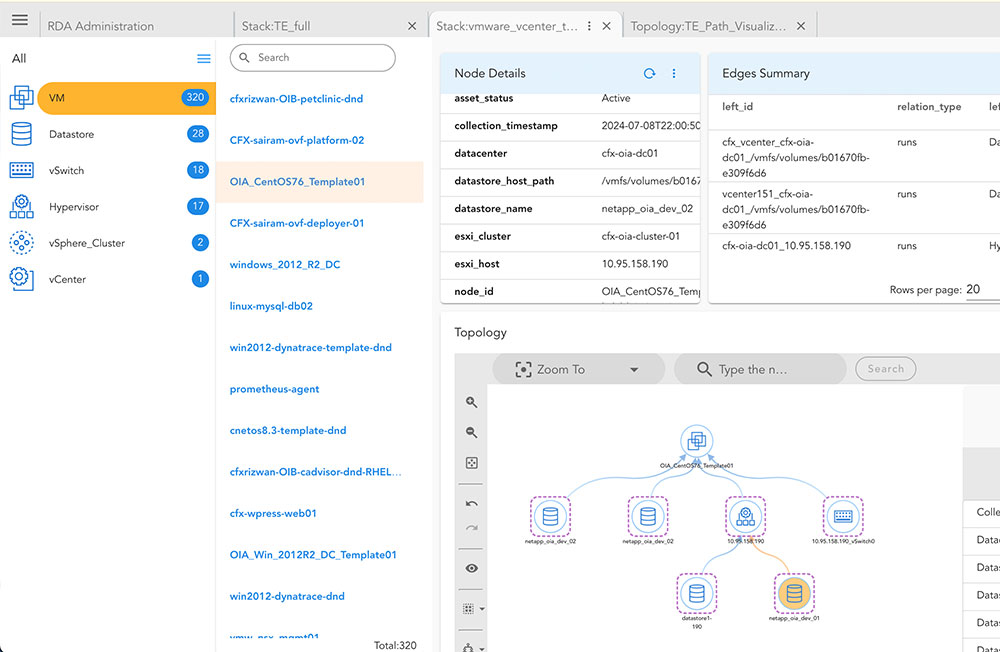
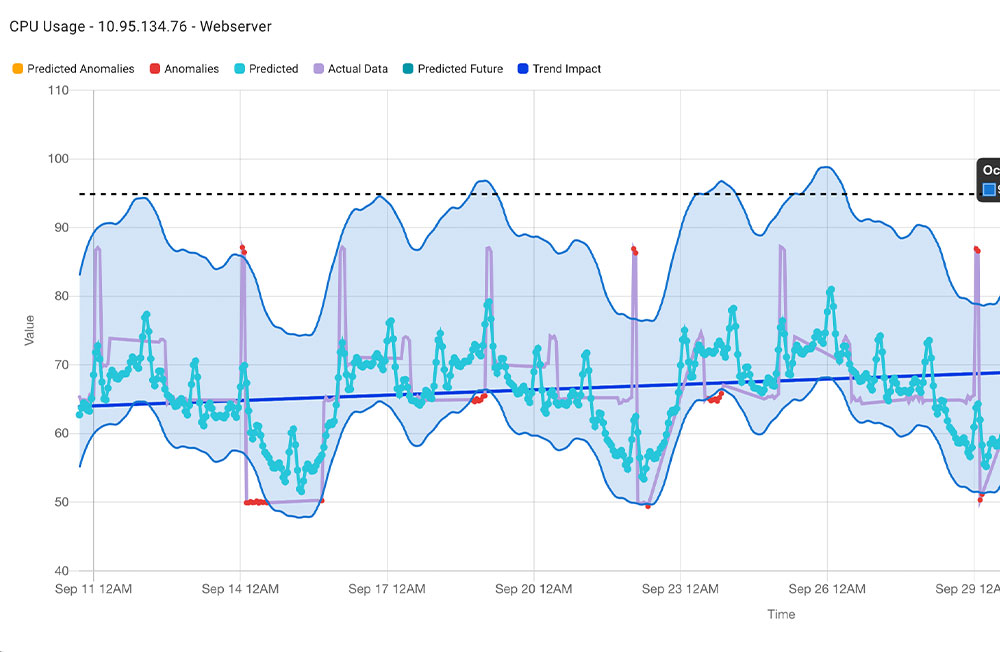
Fabrix.ai storyboards and dashboards are designed to provide a tailored infrastructure and network-centric operations experience.
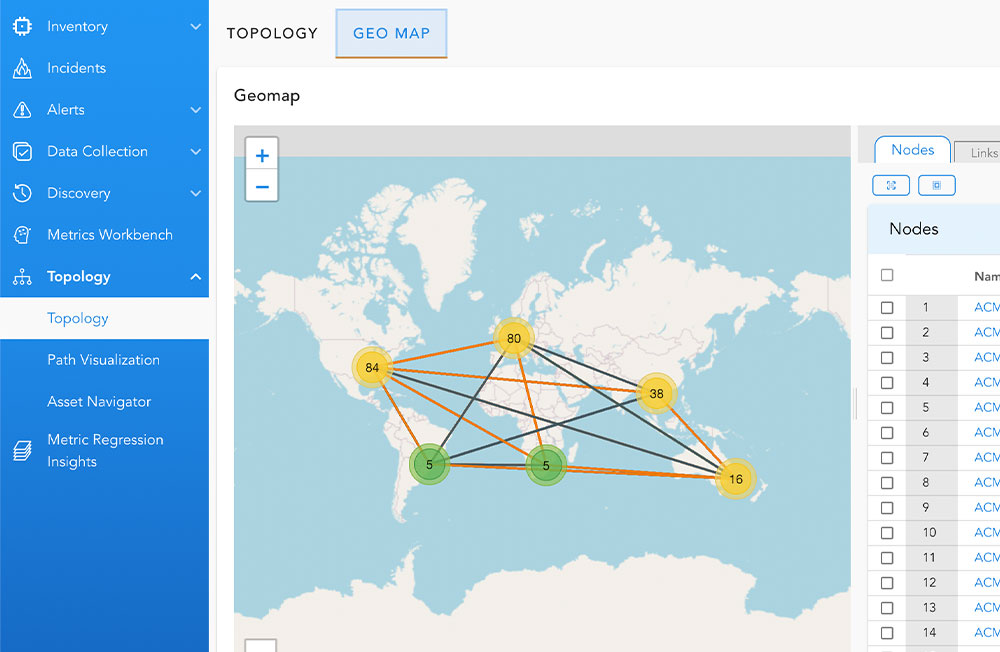
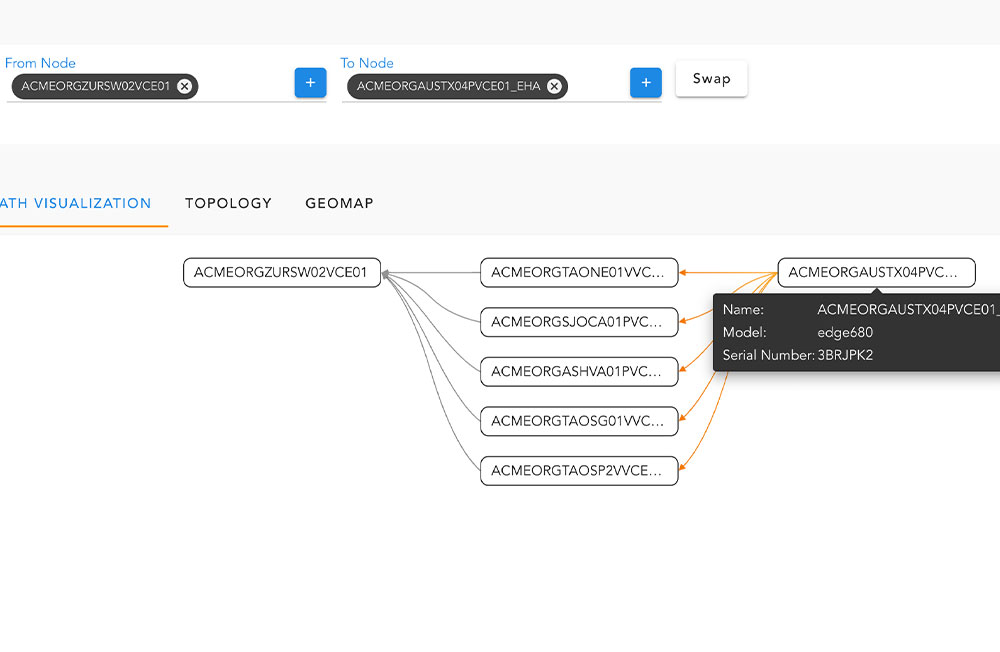
- Graph topologies
- Path visualization
- Dynamic dashboards
- Interactive asset navigator
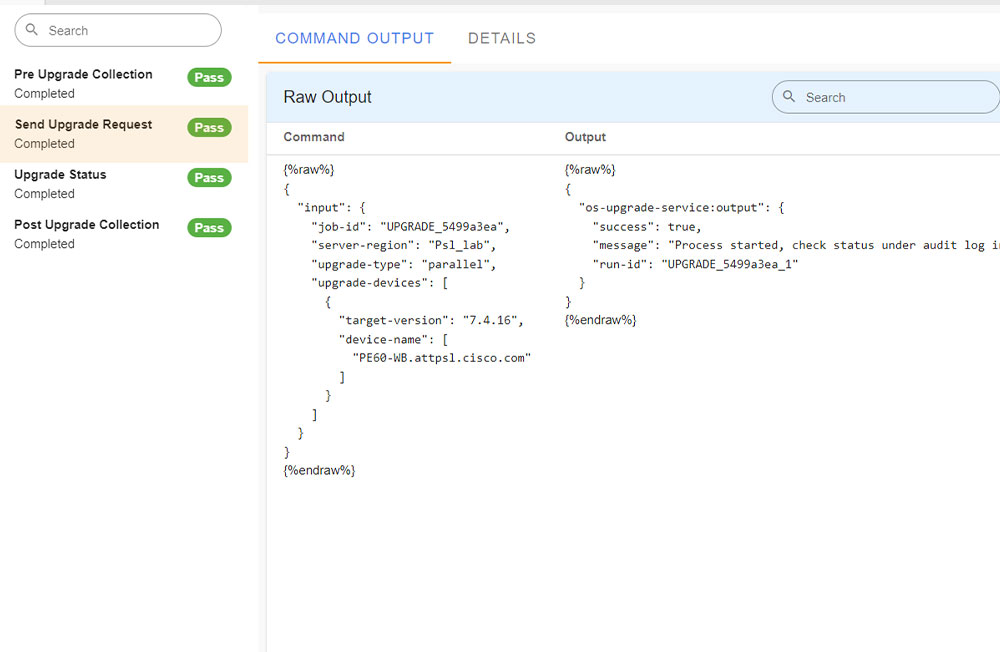
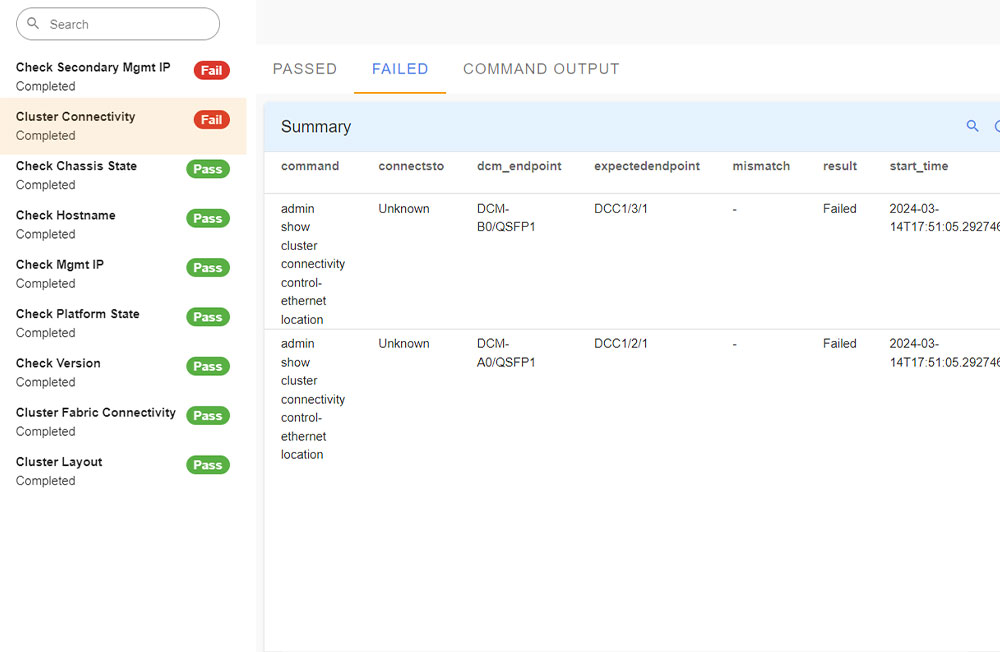
- Automations: collect diagnostics, run workflows, pre/post upgrade data collection and verification, check cluster and fabric connectivity, collect interface data, verify controllers and more
Network Operations Capabilities
From discovery to resolution: inventory, topology, fault and performance, correlation, automation and incident management.
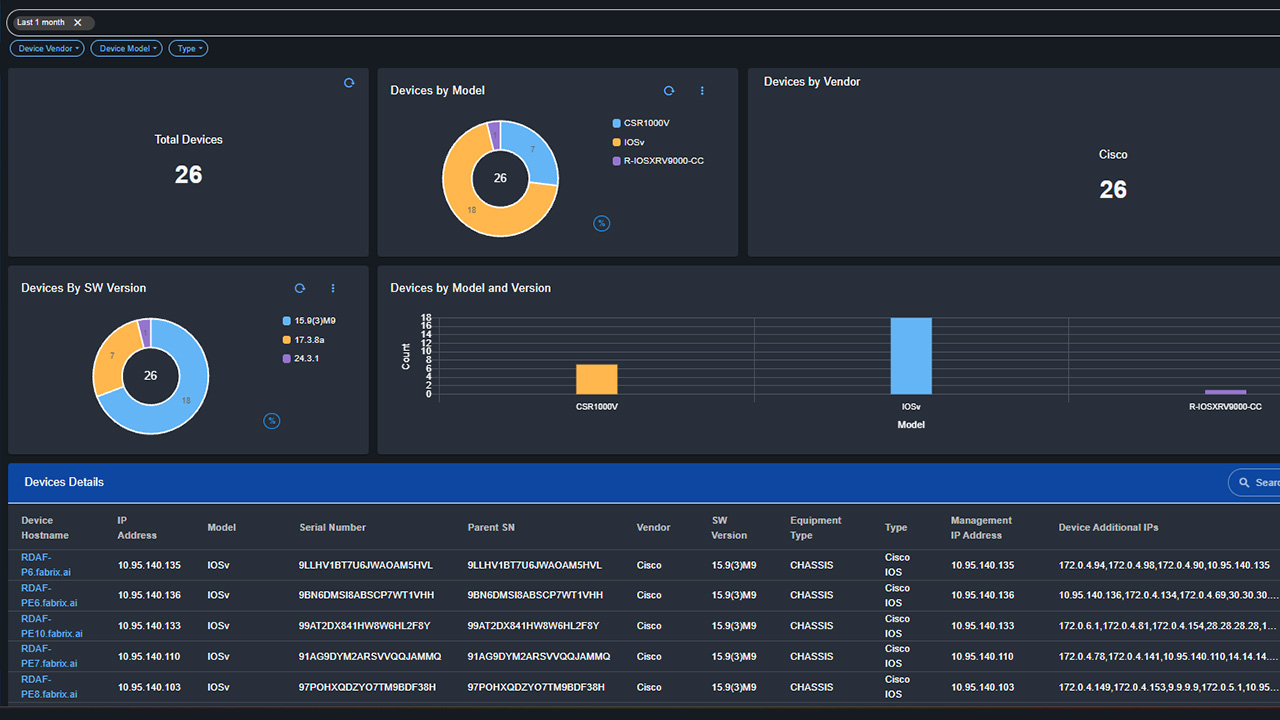
Network Inventory
Automated discovery and mapping of network devices, protocols (CDP, OSPF, BGP, LLDP, ISIS) and relationships.
- Real-time discovery
- End-of-life and end-of-support identification
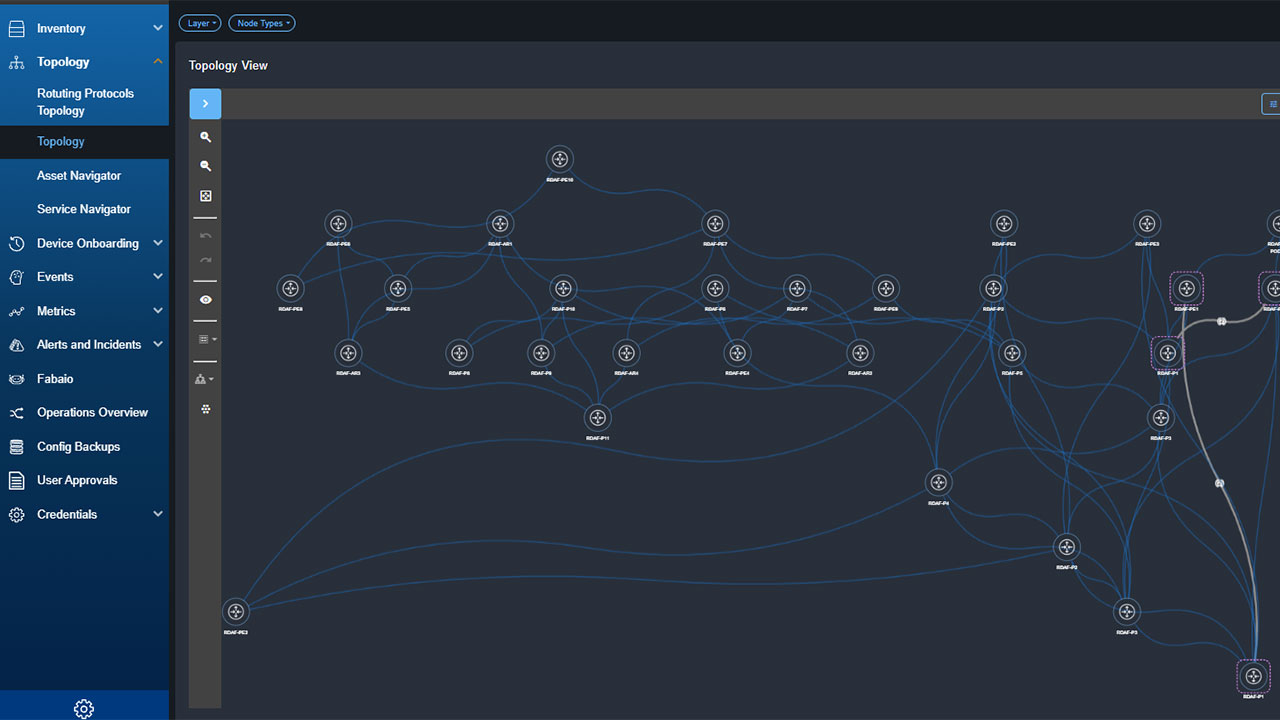
End-to-End Topology
Visualize relationships among network devices, applications and services with interactive maps that trace paths and reveal dependencies in real time.
- Toggle between physical, logical and geospatial views of your entire network
- Trace traffic flows to identify bottlenecks or latency issues
- See exactly how network changes impact applications and business services
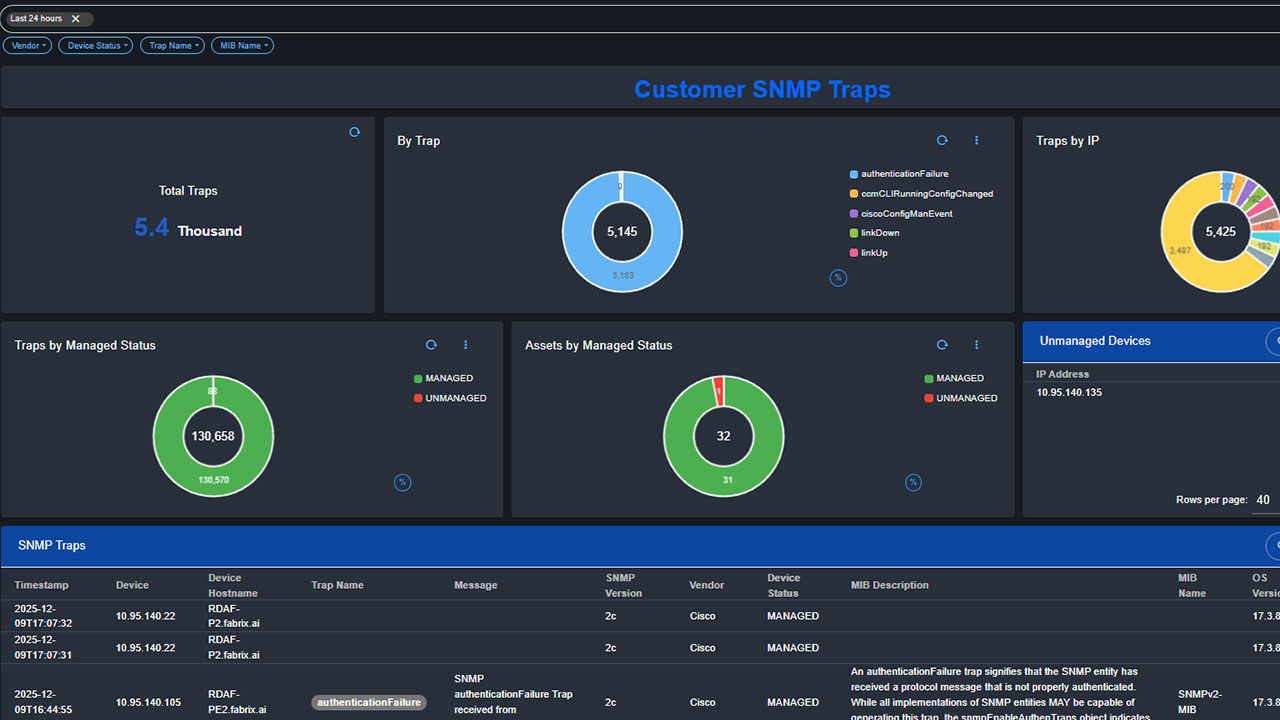
Fault & Performance Management
Collect diagnostics, run workflows, verify pre- and post-upgrade state, check cluster and fabric connectivity, and collect performance data from BulkStats, SNMP, OpenTelemetry and Redfish.
- Closed-loop automation and monitoring
- AI-driven baselining adapts to normal usage to prevent false alarms and spot anomalies
- Faults, performance KPIs and device health in a single pane of glass
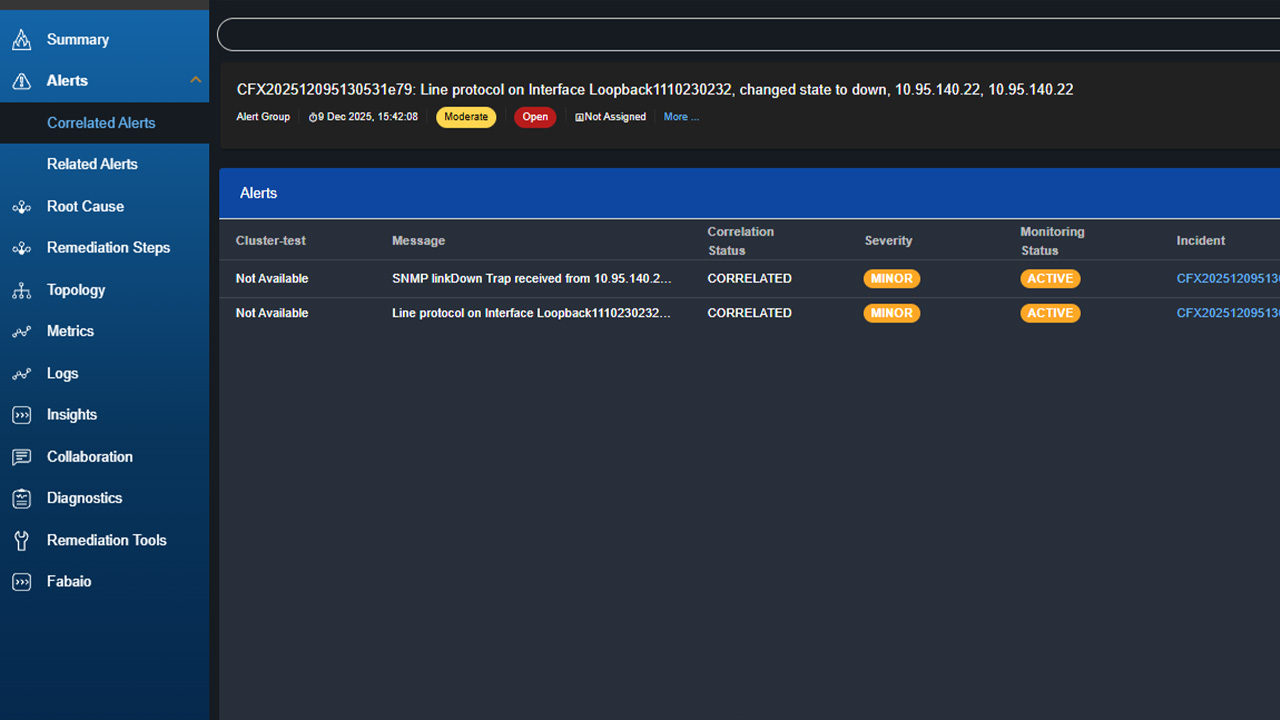
Event Correlation & Auto RCA
Ingest alerts and events from any tool, source or environment, then automatically correlate them and suppress false alarms with AI to identify the root cause.
- Extrapolate impacted applications or services
- Recommendations to tune monitoring behavior
- Auto-create and update actionable incidents in ITSM
Closed Loop Automation
A continuous feedback cycle of monitoring, identifying, adjusting and optimizing IT and network performance without manual intervention.
- Auto-remediation: trigger Ansible, Python or Cisco NSO playbooks from analyzed alerts
- Configuration management: detect drift and restore compliant settings
- Human-in-the-loop: require approval before sensitive changes
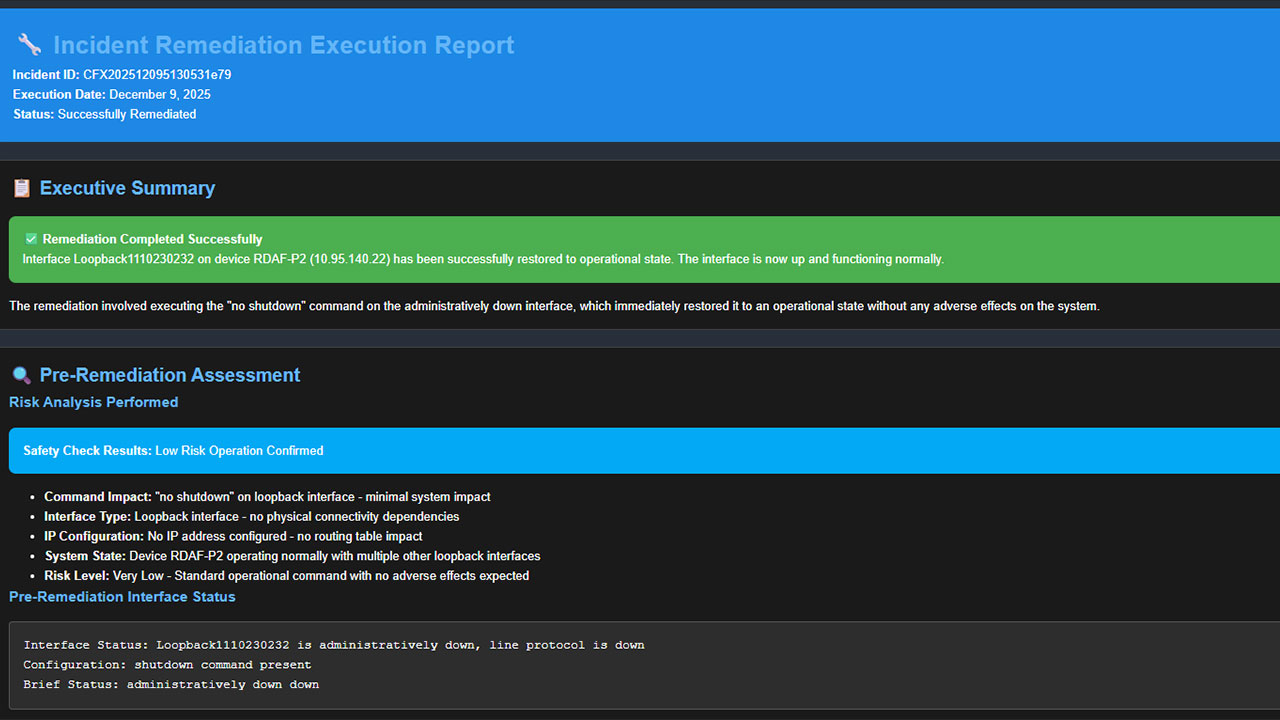
Incident Management
Retrieve incidents and updates through bi-directional ITSM integration, organize them by project, queue or customer, and automate handling with workflows or runbooks through RPA/IPA tools.
- Auto-create tickets with correct priority, categorization and routing
- Attach topology maps, logs and diagnostics directly to the ticket
- Resolve in the monitoring tool and automatically close the ITSM ticket
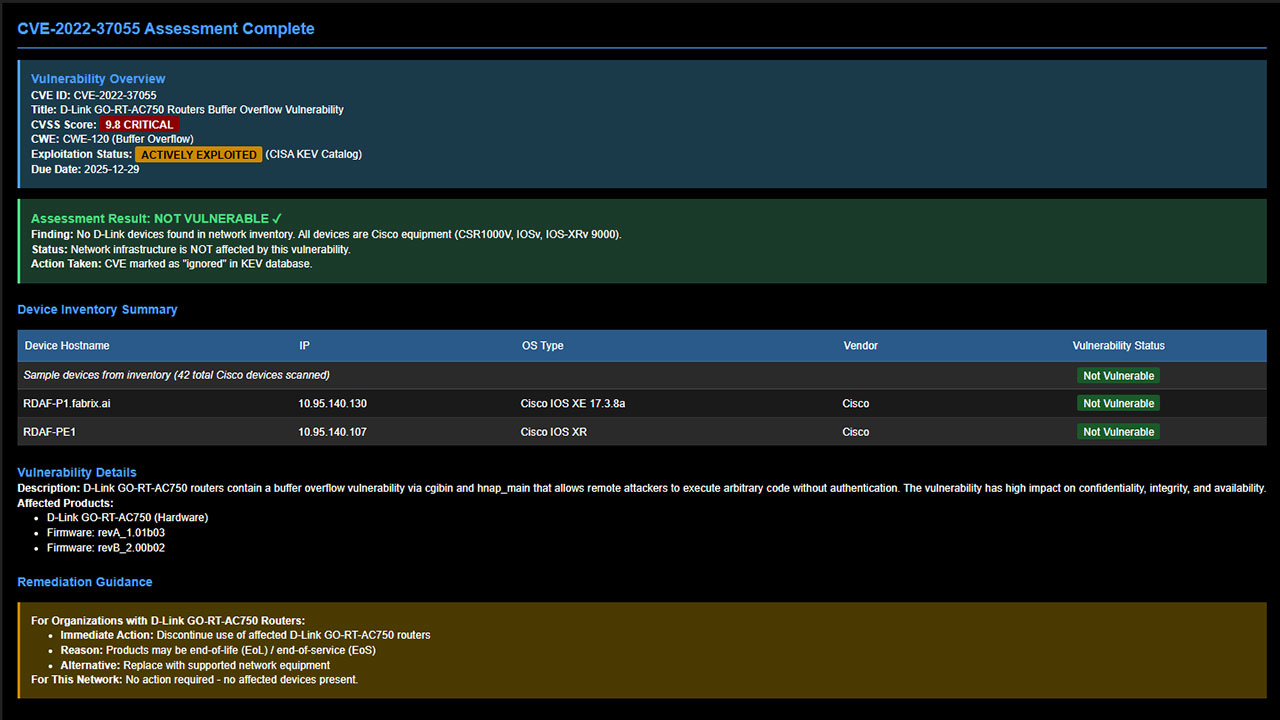
AI Driven End-to-End Network Operations
By consolidating data and insights into a single platform, Fabrix.ai eliminates silos and offers true end-to-end visibility, including network dependencies.
-

Geo Mapping
-

Topology
-

Topology View
-

Topology View
-

Path Visualization
-

Path Visualization Topology